Ergebnis zur Kreistagswahl 2014 am 16.03.2014
Landkreis Dillingen a.d.Donau - Gemeinde Binswangen
Es wurden alle Stimmbezirke ausgewertet.
 Diagramm
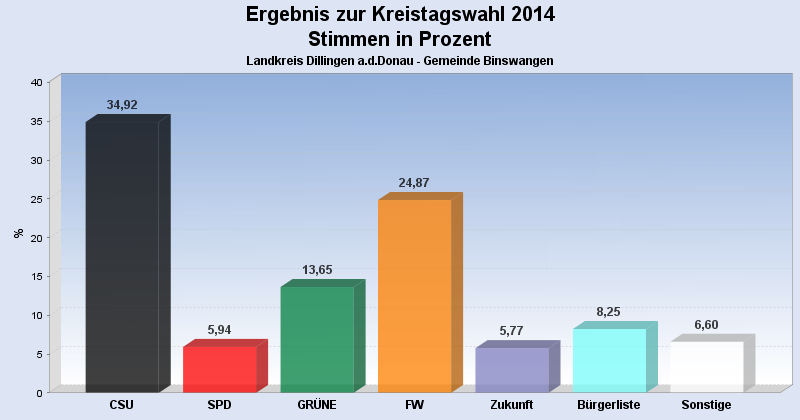
 Seitenanfang
Wahlbeteiligung, Stimmzettel, Stimmen
| Wahlbeteiligung: | 67,87% |
|---|---|
| Stimmberechtigte: | 1.055 |
| Wähler: | 716 |
| Ungültige Stimmen: | 28 |
| Gültige Stimmen: | 32.856 |
Stimmen nach Wahlvorschlag
| Partei | Stimmen | Prozent | WV unveränd. gekennzeichnet |
innerh. eines WV's veränd. |
|
|---|---|---|---|---|---|
| 1 | CSU | 11.474 | 34,92% | 39 | 26 |
| 2 | SPD | 1.952 | 5,94% | 8 | 0 |
| 4 | GRÜNE | 4.485 | 13,65% | 26 | 4 |
| 5 | FW | 8.170 | 24,87% | 22 | 19 |
| 6 | FDP | 946 | 2,88% | 3 | 0 |
| 7 | Zukunft | 1.897 | 5,77% | 5 | 0 |
| 8 | REP | 1.223 | 3,72% | 9 | 4 |
| 9 | Bürgerliste | 2.709 | 8,25% | 2 | 2 |
- Stand: 03.04.2014 09:00:50