Ergebnis zur Kreistagswahl 2014 am 16.03.2014
Landkreis Dillingen a.d.Donau - Stadt Gundelfingen a.d.Donau
Es wurden alle Stimmbezirke ausgewertet.
 Diagramm
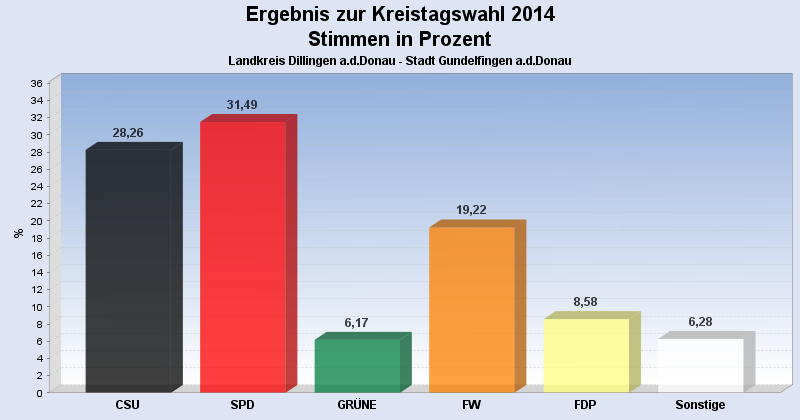
 Seitenanfang
Wahlbeteiligung, Stimmzettel, Stimmen
| Wahlbeteiligung: | 48,41% |
|---|---|
| Stimmberechtigte: | 5.807 |
| Wähler: | 2.811 |
| Ungültige Stimmen: | 86 |
| Gültige Stimmen: | 140.485 |
Stimmen nach Wahlvorschlag
| Partei | Stimmen | Prozent | WV unveränd. gekennzeichnet |
innerh. eines WV's veränd. |
|
|---|---|---|---|---|---|
| 1 | CSU | 39.695 | 28,26% | 128 | 227 |
| 2 | SPD | 44.236 | 31,49% | 66 | 185 |
| 4 | GRÜNE | 8.669 | 6,17% | 52 | 36 |
| 5 | FW | 27.008 | 19,22% | 52 | 76 |
| 6 | FDP | 12.057 | 8,58% | 14 | 28 |
| 7 | Zukunft | 3.746 | 2,67% | 5 | 5 |
| 8 | REP | 3.402 | 2,42% | 20 | 16 |
| 9 | Bürgerliste | 1.672 | 1,19% | 1 | 5 |
- Stand: 03.04.2014 09:01:03