Ergebnis zur Kreistagswahl 2014 am 16.03.2014
Landkreis Dillingen a.d.Donau - Gemeinde Holzheim
Es wurden alle Stimmbezirke ausgewertet.
 Diagramm
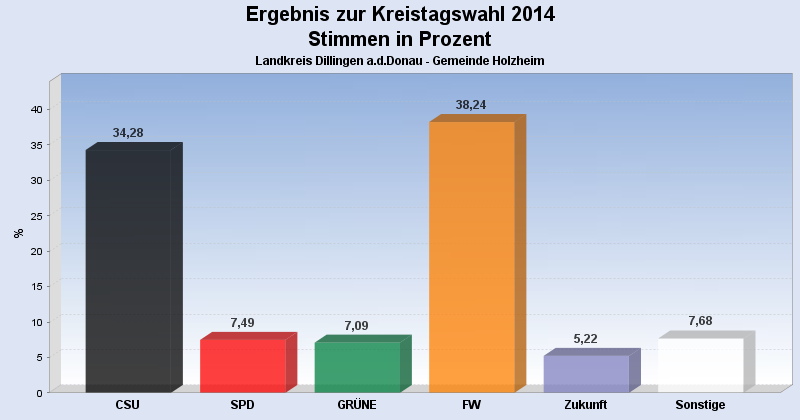
 Seitenanfang
Wahlbeteiligung, Stimmzettel, Stimmen
| Wahlbeteiligung: | 55,36% |
|---|---|
| Stimmberechtigte: | 2.964 |
| Wähler: | 1.641 |
| Ungültige Stimmen: | 47 |
| Gültige Stimmen: | 78.964 |
Stimmen nach Wahlvorschlag
| Partei | Stimmen | Prozent | WV unveränd. gekennzeichnet |
innerh. eines WV's veränd. |
|
|---|---|---|---|---|---|
| 1 | CSU | 27.071 | 34,28% | 111 | 156 |
| 2 | SPD | 5.914 | 7,49% | 27 | 12 |
| 4 | GRÜNE | 5.602 | 7,09% | 27 | 21 |
| 5 | FW | 30.194 | 38,24% | 108 | 218 |
| 6 | FDP | 2.307 | 2,92% | 8 | 6 |
| 7 | Zukunft | 4.121 | 5,22% | 4 | 7 |
| 8 | REP | 1.472 | 1,86% | 11 | 10 |
| 9 | Bürgerliste | 2.283 | 2,89% | 8 | 4 |
- Stand: 03.04.2014 09:01:09