Ergebnis zur Kreistagswahl 2014 am 16.03.2014
Landkreis Dillingen a.d.Donau - Markt Wittislingen
Es wurden alle Stimmbezirke ausgewertet.
 Diagramm
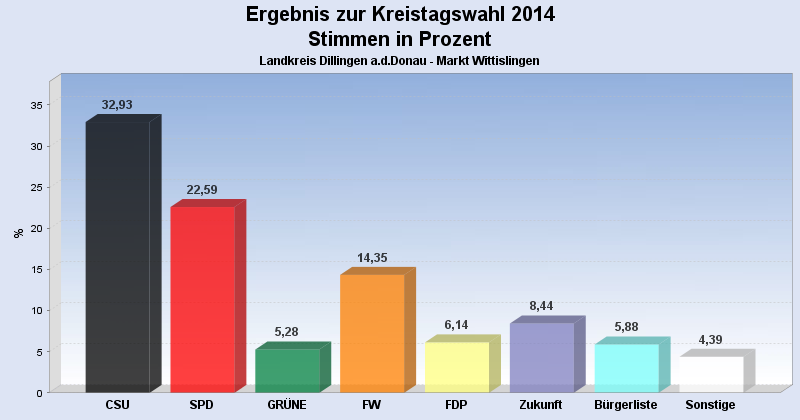
 Seitenanfang
Wahlbeteiligung, Stimmzettel, Stimmen
| Wahlbeteiligung: | 60,20% |
|---|---|
| Stimmberechtigte: | 1.857 |
| Wähler: | 1.118 |
| Ungültige Stimmen: | 57 |
| Gültige Stimmen: | 53.656 |
Stimmen nach Wahlvorschlag
| Partei | Stimmen | Prozent | WV unveränd. gekennzeichnet |
innerh. eines WV's veränd. |
|
|---|---|---|---|---|---|
| 1 | CSU | 17.667 | 32,93% | 50 | 140 |
| 2 | SPD | 12.123 | 22,59% | 24 | 62 |
| 4 | GRÜNE | 2.833 | 5,28% | 10 | 14 |
| 5 | FW | 7.701 | 14,35% | 13 | 36 |
| 6 | FDP | 3.292 | 6,14% | 1 | 5 |
| 7 | Zukunft | 4.527 | 8,44% | 5 | 7 |
| 8 | REP | 2.356 | 4,39% | 8 | 20 |
| 9 | Bürgerliste | 3.157 | 5,88% | 4 | 10 |
- Stand: 03.04.2014 09:01:24