Ergebnis zur Kreistagswahl 2014 am 16.03.2014
Landkreis Dillingen a.d.Donau - Gemeinde Zusamaltheim
Es wurden alle Stimmbezirke ausgewertet.
 Diagramm
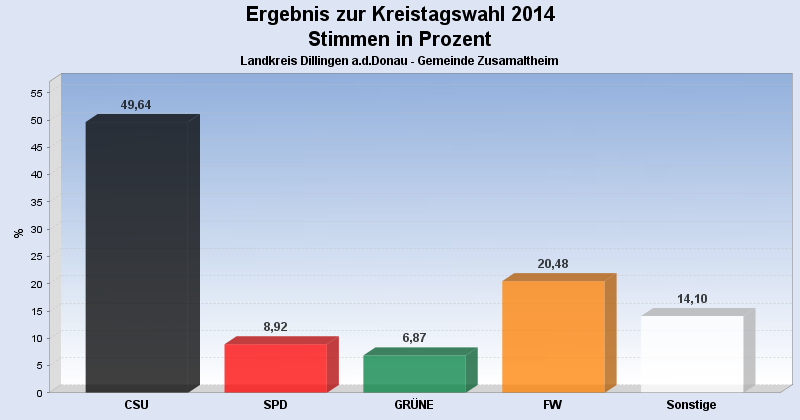
 Seitenanfang
Wahlbeteiligung, Stimmzettel, Stimmen
| Wahlbeteiligung: | 57,59% |
|---|---|
| Stimmberechtigte: | 962 |
| Wähler: | 554 |
| Ungültige Stimmen: | 25 |
| Gültige Stimmen: | 26.441 |
Stimmen nach Wahlvorschlag
| Partei | Stimmen | Prozent | WV unveränd. gekennzeichnet |
innerh. eines WV's veränd. |
|
|---|---|---|---|---|---|
| 1 | CSU | 13.125 | 49,64% | 80 | 32 |
| 2 | SPD | 2.359 | 8,92% | 20 | 1 |
| 4 | GRÜNE | 1.816 | 6,87% | 11 | 3 |
| 5 | FW | 5.414 | 20,48% | 24 | 5 |
| 6 | FDP | 546 | 2,06% | 0 | 0 |
| 7 | Zukunft | 1.214 | 4,59% | 2 | 0 |
| 8 | REP | 920 | 3,48% | 5 | 2 |
| 9 | Bürgerliste | 1.047 | 3,96% | 7 | 0 |
- Stand: 03.04.2014 09:01:27